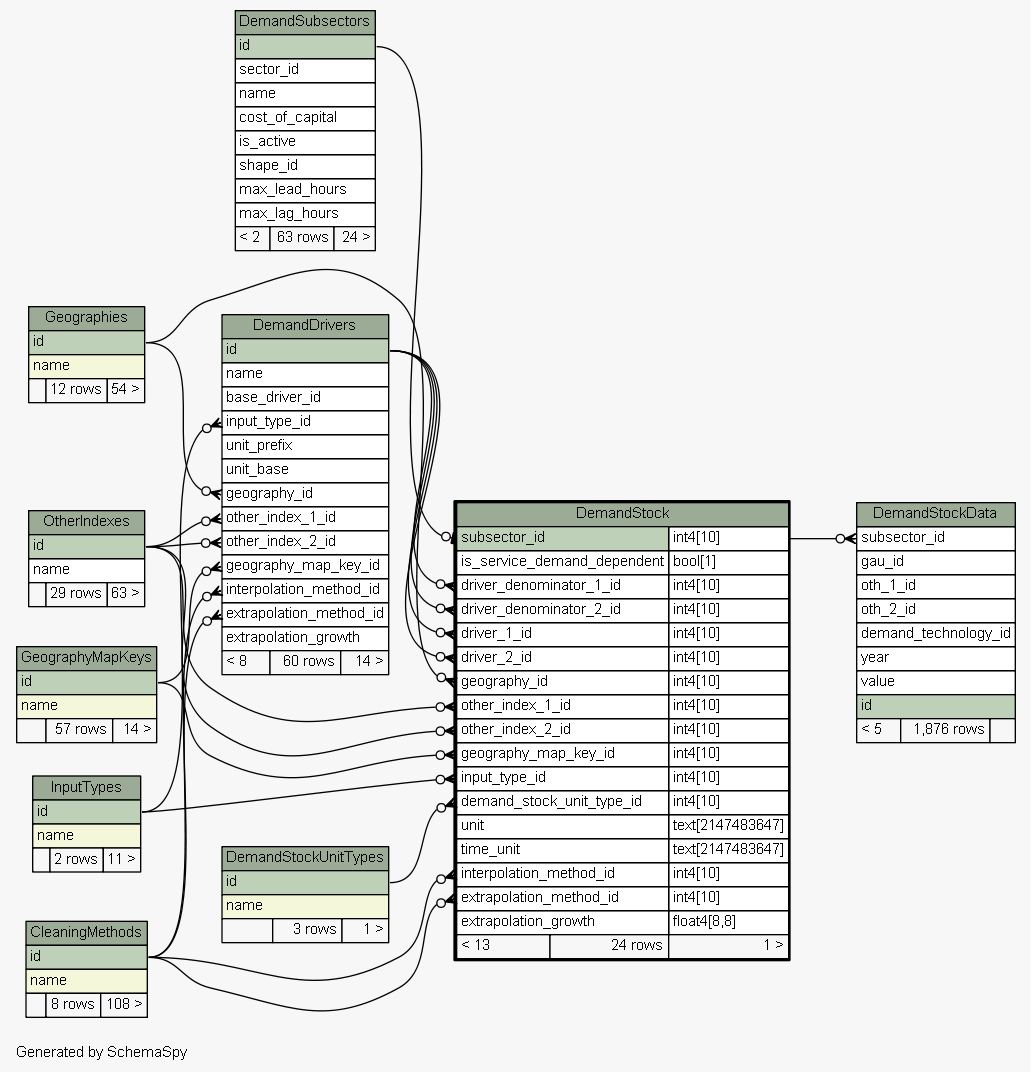
Table pathways_us_2017-1-15.public.DemandStock
Stock by technology input options for subsectors.

Generated by
SchemaSpy
Legend:
Primary key columns
Columns with indexes
Implied relationships
Excluded column relationships
< n > number of related tables
 
Column Type Size Nulls Auto Default Children Parents Comments
subsector_id int4 10
DemandStockData.subsector_id DemandStockData_subsector_id_fkey C
DemandSubsectors.id DemandStock_subsector_id_fkey R
Parent subsector.
is_service_demand_dependent bool 1  √  false If stock is service demand dependent it means that total stock it is proportional to total service demand. In this case, service demand is solved first and becomes a driver of stock. More about demand drivers here: https://docs.google.com/document/d/19cspAg2El5d1dvQggi7Vx8XJ1al-11IDf6DgRbpk-FU/edit#heading=h.94rqs9slq4zx
driver_denominator_1_id int4 10  √  null
DemandDrivers.id DemandStock_driver_denominator_1_id_fkey R
If the data is an intensity, what driver is in the denominator? For example, if the subsector is light duty autos, and the data is input is number of vehicles per capita, population will be the driver in the denominator.
driver_denominator_2_id int4 10  √  null
DemandDrivers.id DemandStock_driver_denominator_2_id_fkey R
Accommodates a second driver in the denominator of the inputs.
driver_1_id int4 10  √  null
DemandDrivers.id DemandStock_driver_1_id_fkey R
Total stock in the model will increase or decrease proportionally with this driver.
driver_2_id int4 10  √  null
DemandDrivers.id DemandStock_driver_2_id_fkey R
Second stock driver.
geography_id int4 10  √  null
Geographies.id DemandStock_geography_id_fkey R
Input geography for the data (e.g. state)
other_index_1_id int4 10  √  null
OtherIndexes.id DemandStock_other_index_1_id_fkey R
First sub category for the input data (e.g. housing type)
other_index_2_id int4 10  √  null
OtherIndexes.id DemandStock_other_index_2_id_fkey R
Second sub category for the input data (e.g. housing type)
geography_map_key_id int4 10  √  null
GeographyMapKeys.id DemandStock_geography_map_key_id_fkey R
Basis for mapping between geographies. For example, if my input data is for the entire country and I want to allocate the data to each state, do it based on the proportional share of households in each state. For more information, see: https://docs.google.com/document/d/19cspAg2El5d1dvQggi7Vx8XJ1al-11IDf6DgRbpk-FU/edit#heading=h.n712kivlou9l
input_type_id int4 10  √  null
InputTypes.id DemandStock_input_type_id_fkey R
Total or intensity.
demand_stock_unit_type_id int4 10  √  null
DemandStockUnitTypes.id DemandStock_demand_stock_unit_type_id_fkey R
Equipment, service demand, or capacity factor
unit text 2147483647  √  null Input unit
time_unit text 2147483647  √  null Time unit associated with an input in capacity terms. For example, heating stock may be given in kiloBtu per hour. Hour would be the time unit.
interpolation_method_id int4 10  √  null
CleaningMethods.id DemandStock_interpolation_method_id_fkey R
Cleaning method used to interpolate between missing years when data is entered.
extrapolation_method_id int4 10  √  null
CleaningMethods.id DemandStock_extrapolation_method_id_fkey R
Cleaning method used to extrapolate to missing years when data is entered.
extrapolation_growth float4 8,8  √  null If extrapolation method exponential is used, what is the year over year growth rate?

Table contained 24 rows at Tue Jan 17 22:23 PST 2017

Indexes:
Column(s) Type Sort Constraint Name
subsector_id Primary key Asc DemandStock_pkey

Close relationships  within of separation: