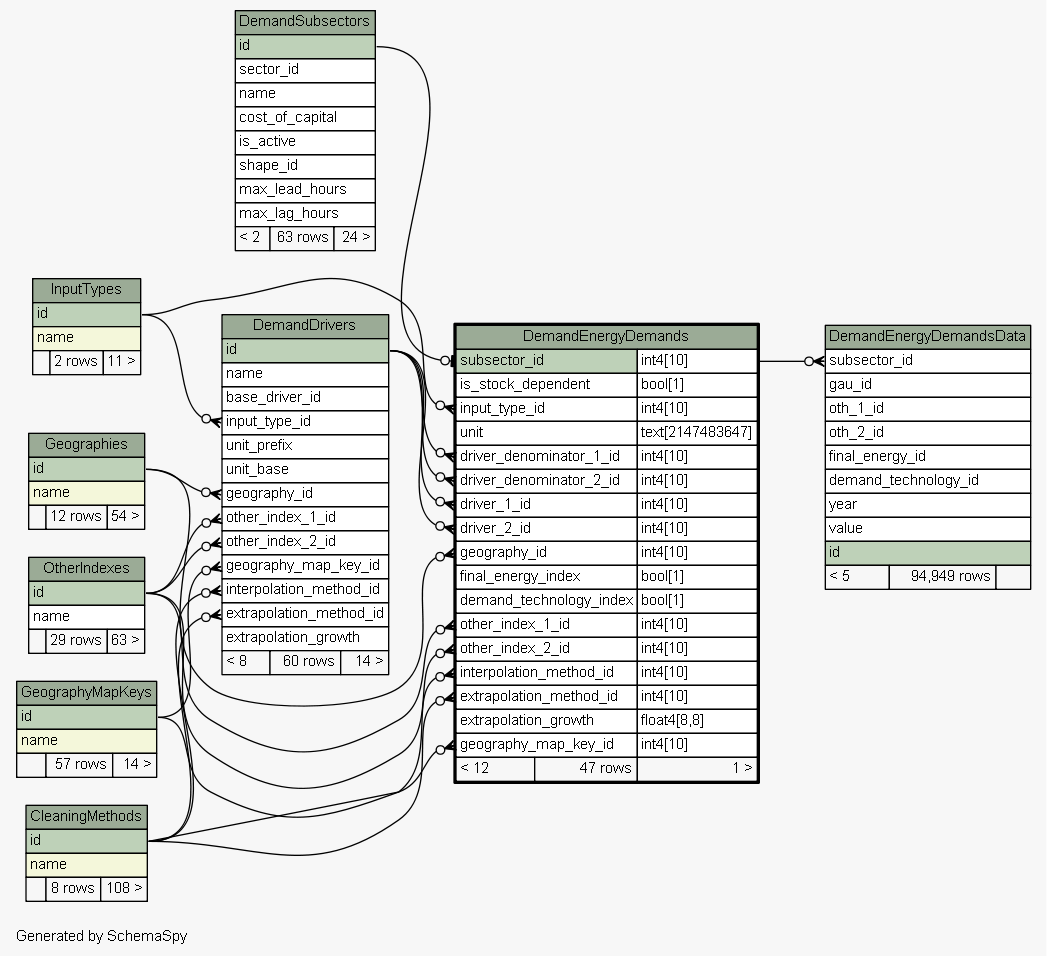
Table pathways_us_2017-1-15.public.DemandEnergyDemands
For each demand subsector, what is the historical, or projected, energy demand?

Generated by
SchemaSpy
Legend:
Primary key columns
Columns with indexes
Implied relationships
Excluded column relationships
< n > number of related tables
 
Column Type Size Nulls Auto Default Children Parents Comments
subsector_id int4 10
DemandEnergyDemandsData.subsector_id DemandEnergyDemandsData_subsector_id_fkey R
DemandSubsectors.id DemandEnergyDemands_subsector_id_fkey R
id for the demand subsector
is_stock_dependent bool 1  √  false This is a boolean indicating whether the energy demand depends on the size of the stock (e.g. HVAC energy demand depends on the total number of HVAC units).
input_type_id int4 10  √  null
InputTypes.id DemandEnergyDemands_input_type_id_fkey R
Input data is either a total or an intensity.
unit text 2147483647  √  null Energy unit for the given inputs.
driver_denominator_1_id int4 10  √  null
DemandDrivers.id DemandEnergyDemands_driver_denominator_1_id_fkey R
If the data is an intensity, what driver is in the denominator? For example, if the subsector is commercial water heating, and the data is input in kBtu per commercial square foot, kBtu will be the unit and commercial square foot will be the driver in the denominator.
driver_denominator_2_id int4 10  √  null
DemandDrivers.id DemandEnergyDemands_driver_denominator_2_id_fkey R
Accommodates a second driver in the denominator of the inputs.
driver_1_id int4 10  √  null
DemandDrivers.id DemandEnergyDemands_driver_1_id_fkey R
Energy demand grows or shrinks in proportion to this driver.
driver_2_id int4 10  √  null
DemandDrivers.id DemandEnergyDemands_driver_2_id_fkey R
Energy demand grows or shrinks in proportion to this driver.
geography_id int4 10  √  null
Geographies.id DemandEnergyDemands_geography_id_fkey R
Input geography for the data (e.g. state)
final_energy_index bool 1  √  null
demand_technology_index bool 1  √  null
other_index_1_id int4 10  √  null
OtherIndexes.id DemandEnergyDemands_other_index_1_id_fkey R
First sub category for the input data (e.g. housing type)
other_index_2_id int4 10  √  null
OtherIndexes.id DemandEnergyDemands_other_index_2_id_fkey R
Second sub category for the input data (e.g. housing type)
interpolation_method_id int4 10  √  null
CleaningMethods.id DemandEnergyDemands_interpolation_method_id_fkey R
Cleaning method used to interpolate between missing years when data is entered.
extrapolation_method_id int4 10  √  null
CleaningMethods.id DemandEnergyDemands_extrapolation_method_id_fkey R
Cleaning method used to extrapolate to missing years when data is entered.
extrapolation_growth float4 8,8  √  null If extrapolation method exponential is used, what is the year over year growth rate?
geography_map_key_id int4 10  √  null
GeographyMapKeys.id DemandEnergyDemands_geography_map_key_id_fkey R
Basis for mapping between geographies. For example, if my input data is for the entire country and I want to allocate the data to each state, do it based on the proportional share of households in each state. For more information, see: https://docs.google.com/document/d/19cspAg2El5d1dvQggi7Vx8XJ1al-11IDf6DgRbpk-FU/edit#heading=h.n712kivlou9l

Table contained 47 rows at Tue Jan 17 22:23 PST 2017

Indexes:
Column(s) Type Sort Constraint Name
subsector_id Primary key Asc DemandEnergyDemands_pkey

Close relationships  within of separation: