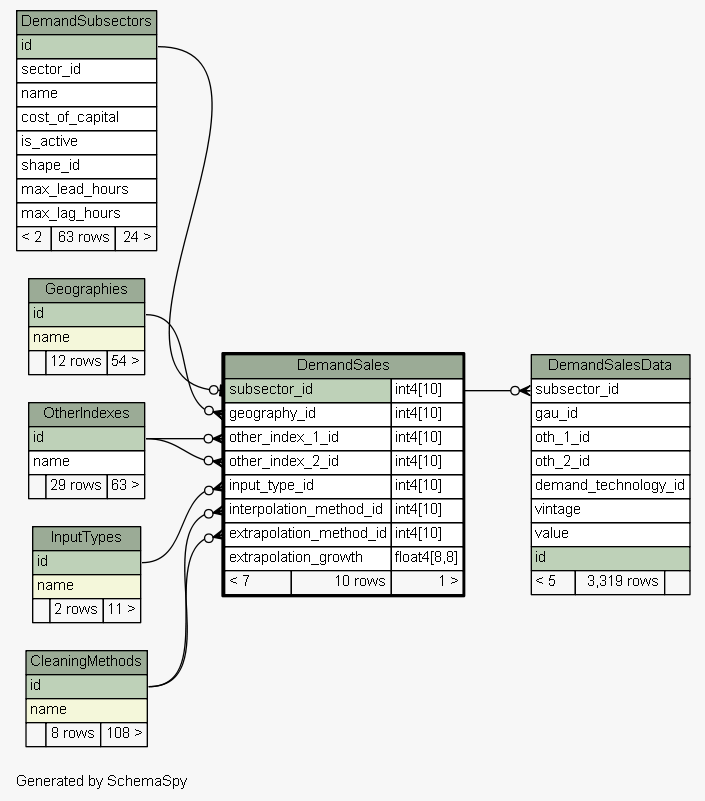
Table pathways_us_2017-1-15.public.DemandSales
Demand sales by vintage within certain subsectors. Sales are specified by vintage.

Generated by
SchemaSpy
Legend:
Primary key columns
Columns with indexes
Implied relationships
Excluded column relationships
< n > number of related tables
 
Column Type Size Nulls Auto Default Children Parents Comments
subsector_id int4 10
DemandSalesData.subsector_id DemandSalesData_subsector_id_fkey R
DemandSubsectors.id DemandSales_subsector_id_fkey R
geography_id int4 10  √  null
Geographies.id DemandSales_geography_id_fkey R
Input geography for the data (e.g. state)
other_index_1_id int4 10  √  null
OtherIndexes.id DemandSales_other_index_1_id_fkey R
First sub category for the input data (e.g. housing type)
other_index_2_id int4 10  √  null
OtherIndexes.id DemandSales_other_index_2_id_fkey R
Second sub category for the input data (e.g. housing type)
input_type_id int4 10  √  null
InputTypes.id DemandSales_input_type_id_fkey R
Input data is either a total or an intensity.
interpolation_method_id int4 10  √  null
CleaningMethods.id DemandSales_interpolation_method_id_fkey R
Cleaning method used to interpolate between missing years when data is entered.
extrapolation_method_id int4 10  √  null
CleaningMethods.id DemandSales_extrapolation_method_id_fkey R
Cleaning method used to extrapolate to missing years when data is entered.
extrapolation_growth float4 8,8  √  null If extrapolation method exponential is used, what is the year over year growth rate?

Table contained 10 rows at Tue Jan 17 22:23 PST 2017

Indexes:
Column(s) Type Sort Constraint Name
subsector_id Primary key Asc DemandSales_pkey

Close relationships  within of separation: